Civilization: Powered by the West, Threatened by the Rest

THIS ARTICLE will consist of three parts. In the first, we will look at how regions and populations have varied in their technological, economic, and scientific advancement going from the ancient world to the present. Then I will review research showing that modern national wealth can be predicted based on how advanced a society was long before the industrial revolution or even recorded history. Finally, I will draw out some important implications that this research has on immigration and history.
Technology and Science
First, let’s look at how technologically advanced various groups have been throughout human history. One way of measuring technological advancement is by creating a list of goods and abilities the possession of which signals being on the cutting edge of technology for a given time period and then counting how many of these items a given society has.
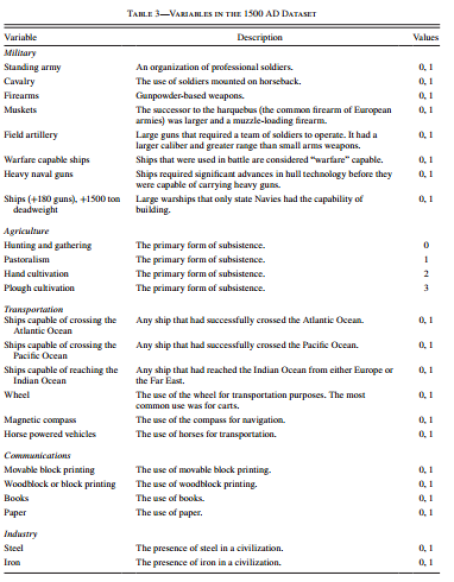
This is the approach taken by Comin, Easterly, and Gong (2010) who constructed the following basket of goods by which to judge civilization’s technological progress between 1000 BC and 0 AD:

And this was the basket of goods used for 1500 AD:
Here is the average score of different populations for each era:
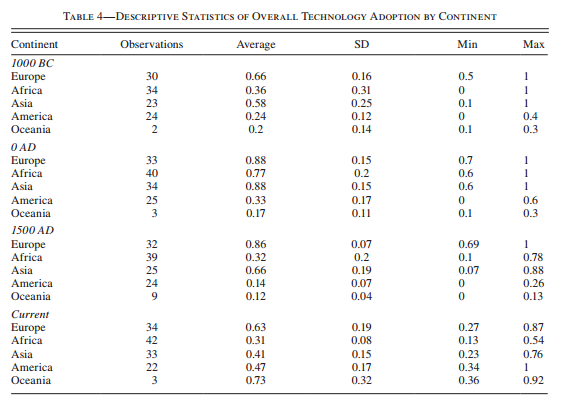
A lot could be said about this table, but in relation to other data we’ll see in this article the important thing to note is that in 1000 BC and 1500 AD European people were more technologically advanced than any other group and in 0 AD they tied with Asia.
The above table is based on every population with each region that Comin et al. could find data for. However, Comin et al. also looked at what regional comparisons looked like when only judging a region based on its most advanced civilization. Here are those results:
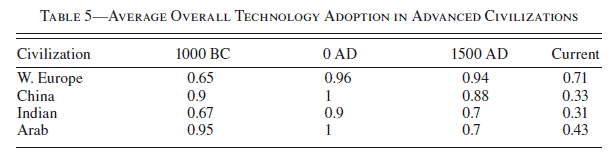
Here, we see that the most advanced Asians had better technology than the most advanced Europeans in the year 1000 BC and 0 AD and that it may not have been until as late as 1500 AD that the most advanced civilizations in the world came to be European ones.
1500 AD is prior to the industrial revolution, most of the transcontinental slave trade, and colonialism, and, consequently, this data contradicts several popular notions about what caused Europeans to become the most technologically advanced peoples on earth.
Comin et al. were concerned with how much technology populations had. This is distinct from asking how much technology populations invented. When one population invents something, it will be spread all over the civilized world. This process of technological diffusion did not, however, happen equally in all places. Some areas, such as ancient China and the Mediterranean, have always been centers for international trade. Because of this, they were ideal places to be the recipients of technological diffusion. Other populations, such as northern Europeans or, even more extremely, Sub-Saharan Africans, were geographically and culturally isolated from much of the ancient world and, as a result, did not trade technology with them to nearly the same degree.
Murray (2004) represents the most rigorous attempt to measure innovation by region throughout history. Murray collected 183 comprehensive encyclopedias, histories, etc., of innovation in various fields and made a list of those individuals who were included in at least 50% of the qualified sources within a given field. Murray found that this measure had an extremely high degree of statistical reliability (.93) by showing that arbitrarily breaking the sources into two groups produced two sets of basically identical results. Murray also showed that the same results emerged when he compared sources from different parts of the world, suggesting that eurocentrism did not significantly plague the analysis. Thus, he found that the relevant material showed a strong degree of consensus on which people and events have been historically important in science.
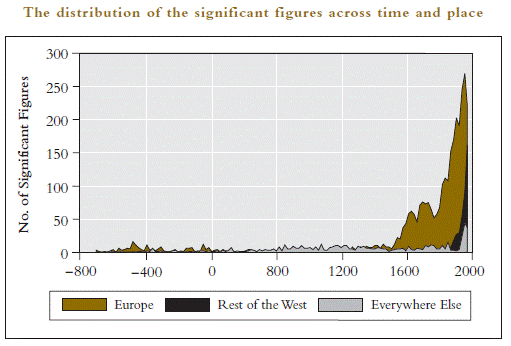
Murray called individuals included in 50% or more of the sources “significant individuals” and events mentioned in 50% or more of sources “significant events”. His analysis included all such individuals who lived, or events which took place, between the years 800 BC and 1950 AD. His results, grouped by continent, can be seen below:
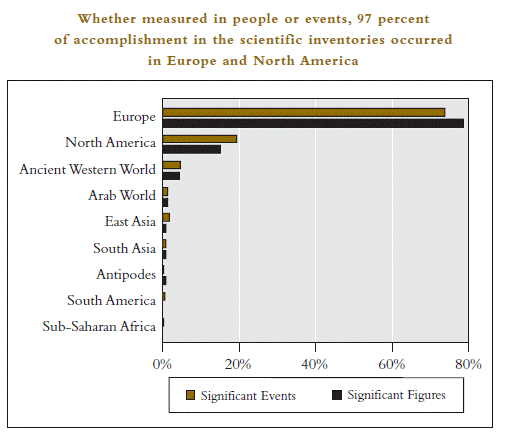
Breaking down this analysis by year, we can see that Europe drove innovation in the BC period, declined in scientific productivity around 100 AD, and then retook its place as the main engine of global scientific advancement around 1500 AD.
Broadly speaking, Comin et al.’s and Murray’s data sets agree as far as they put Europe at the top of technological advancement in the BC period and then show a European decline which ended by 1500 AD. Where they differ is in the degree of Europe’s relative technological superiority during these periods. Comin et al.’s data showed that Europe has often had the best technology in the world, but not massively so. Murray’s data shows that Europeans have been behind nearly every important scientific advancement of the last 2000 years. Thus, the combination of these data sets implies that non-European nations, especially Asian ones, have benefited far more from technological diffusion than has Europe.
Finally, Murray’s data shows that not all European nations have contributed equally to innovation. Actually, almost all of European innovators have come from just a few nations: Britain, France, Germany, and Italy:

Wealth
Now that we have looked at technological progress, let’s turn to economic development. The leading authority on ancient GDP estimates is the economist Angus Maddison. Below, we can see his estimates for wealth per person for the years 1 AD to 1950 AD expressed in 1990 dollars:

There are several important takeaways from this chart. First, Western Europe was the richest region in the world for nearly all the last 2,000 years. The only exception is 1000 AD. Secondly, Western Europe has virtually always been richer than Eastern Europe. This was true long before communism came into the picture. Third, in 1 AD Africa was richer than Eastern Europe and Eastern Asia. In 1 AD Africa was also richer than Africa in 1820 AD. Progress is not inevitable.
The Pre-Historic Roots of Development
So far, I have been comparing rather macro level populations such as “Europe”, “Asia”, and “Africa”. If we break populations down into smaller units, roughly corresponding to the size of individual nations, we can make even more definite statements about the long term consistency of wealth and technology.
Of course, most nations that were around 1,000+ years ago no longer exist. However, we can still test how well the ancient advancement of people in a given geographical area predicts the advancement of people who live in that same area today.
For instance, a nation’s score on Comin et al.’s index of technological progress in 1000 BC predicts its current level of wealth.
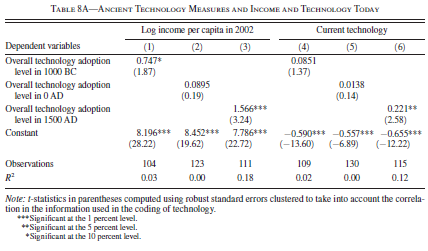
Granted, these correlations are not very strong, but this is because we have not adjusted for ancestry. Ancestry adjustment means that rather than predict an area’s current advancement based on the advancement of the people who lived there in the past we predict it based on the advancement of the descendant populations of the people who there now.
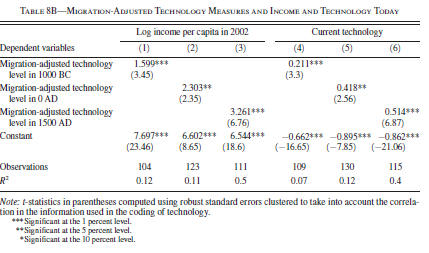
This adjustment can make a big difference. For instance, the technological advancement of the ancestors of the current populations of Australia, Mexico, and the United States, in 0 AD is very different than the technological advancement that was present in Australia and North America in 0 AD. Adjusting Comin et al.’s technological index for ancestry vastly improves its predictive power. After doing so, there is a substantive relationship between ancient levels of technology and modern levels of both wealth and technology.
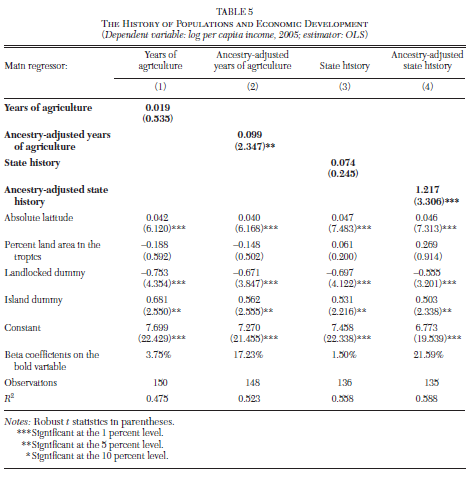
Ancient levels of technology are not the only early predictor of modern success. For instance, the number of years an area has had agriculture or a state correlates with their 2005 GDP per capita at .23 and .26. Adjusting for ancestry raises these correlations to .46 (agriculture) and .48 (state history) (Spolaore and Wacziarg, 2013)
In fact, these variables, in addition with a population’s latitude, and whether or not it is either on an Island or landlocked, can statistically explain 52%-59% of the current variation in national income.
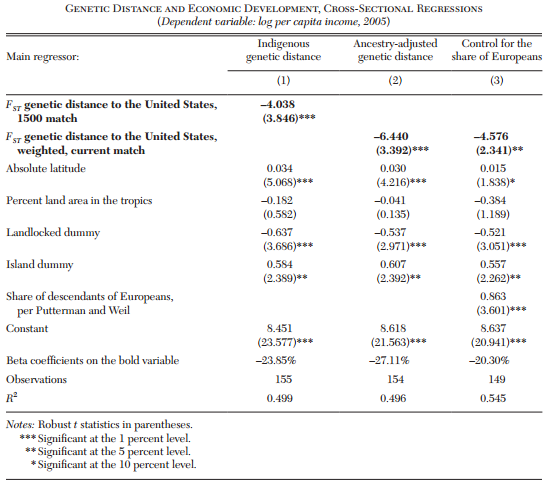
Similarly, the genetic distance between a population and the United states, in conjunction with the previously mentioned geographic variables, statistically explains 50% of current national variation in wealth. If you add to this model the percentage of a nation that is European, 55% of national wealth variation can be statistically accounted for.
As with all statistical associations, this does not prove causality. However, the direction of causality can only run one way; It is not possible that current wealth variation caused differences between populations thousands of years ago. Thus, these statistical associations only leave open the possibility that some ancient variable, either the ones measured in these models or one’s correlated with them, causally explain most modern differences in national wealth.
Moreover, the fact that these models are improved when adjusting for ancestry shows that whatever ancient variable impacted these populations did so in a way that sticks with them when they migrate.
* * *
Source: Read the full article at the Alternative Hypothesis


